Gold Price Chart Today
Today's trading session presented a lucrative opportunity in the gold market, and I successfully executed a trade that leveraged precise technical analysis. This article aims to shed light on the details of the trade, highlighting the decision-making process and the factors that influenced the entry and exit points.
Gold Price Today : Convert Gold Ounce to US Dollar Or vice versa
Gold price chart in U.S. Dollar per ounce, Live gold price chart
Trade Execution:
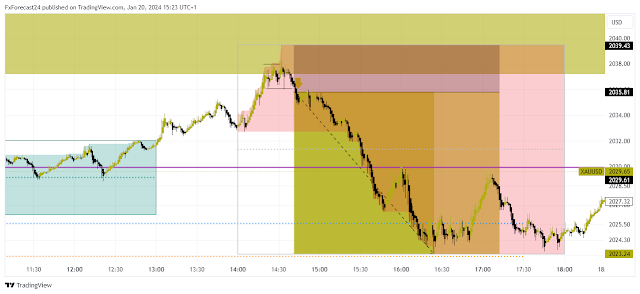
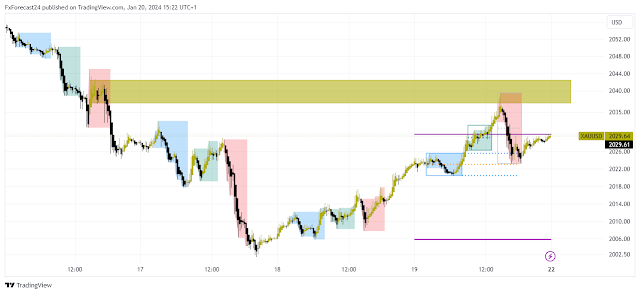
The trade involved selling gold price, and the decision was based on a careful analysis of the price action, chart patterns, and key levels. The selling point was identified in the supply zone around $2037, which had recently undergone a retest in the minute timeframe. This retest provided confirmation of the resistance level, adding conviction to the trade.
 |
| Gold price analysis on 1H Time frame |
Timing the Trade on gold price :
The execution of the trade took place as the correction concluded, and the gold price approached the anticipated selling point. With a calculated risk-reward ratio of one to four, the decision was made to sell gold at $2024. This ratio implies a willingness to risk a certain amount in the pursuit of a fourfold return.
 |
| Gold price entry trade on 1M Time frame |
Risk Management on the gold trade :
Effective risk management is a key component of successful trading. In this gold trade, the risk was carefully managed by setting a stop-loss order to limit potential losses. The risk-reward ratio of one to four ensured that the potential reward outweighed the risk, aligning with a sound risk management strategy.


Post a Comment