Gold Price Analysis: Weekly Outlook for March 18th-22nd, 2024
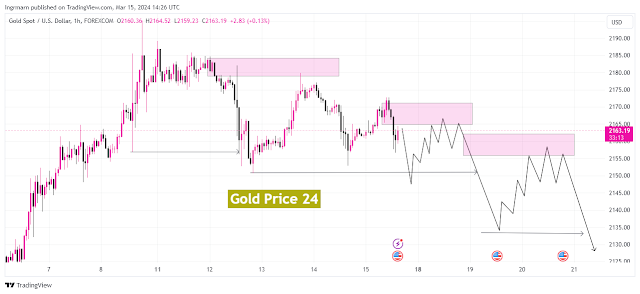
Gold prices experienced a noticeable recovery during the past week before witnessing a significant decline towards the 2154 zone. I expect the correction wave in gold prices to continue in the weekly analysis from March 18th to 22nd, 2024.
 |
| Weekly Gold Analysis March 18-22, 2024 |
I will discuss in this article :
- Gold Price on March 18th, 2024
- Weekly Gold Analysis from March 18th to 22nd, 2024, in the Daily Timeframe
- Weekly Gold Analysis from March 18th to 22nd, 2024, in the Four-Hour Timeframe
1.Gold Price on March 18th, 2024:
The current price of gold on March 18th, 2024, is $2160 per ounce, with the highest daily price of gold so far being $2174 and the lowest daily price being $2154. Meanwhile, the highest weekly price of gold is $2194, and the lowest weekly price is $2154 per ounce.
2.Weekly Gold Analysis from March 18th to 22nd, 2024, in the Daily Timeframe:
After reaching overbought levels and achieving historical record numbers by breaking the last historical peak at $2148 per ounce, the strong uptrend in gold prices in the daily timeframe indicates strong price gaps, confirming the continuation of the uptrend in gold prices over the medium to long term. The chart below in the daily timeframe indicates the possibility of a downward correction in gold prices and inevitably visiting the demand zone at $2072 per ounce.
Therefore, in the daily timeframe, I will enter sell trades against the bullish trend in gold, waiting for prices to reach the demand zone at $2172.
 |
| Weekly Gold Analysis from March 18th to 22nd, 2024, in the Daily Timeframe: |
3.Weekly Gold Analysis from March 18th to 22nd, 2024, in the Four-Hour Timeframe:
As shown in the chart below, gold prices have started a corrective downtrend in the four-hour timeframe. Therefore, we will wait for a break of the last low in the four-hour timeframe and then consider entering sell trades on gold, as illustrated in the chart below.
More Forecast and analysis visit tradingview


Post a Comment